Australia and Technology Patents

(Earlier posting on the 8th August – republished)

Australian (un)employment data released yesterday (7th August 2014) surprised many with a sudden spike in the jobless, especially in the State of Victoria. With Australia entering a transition period following the mining boom a “big” question is what Australia’s future economic strategy foundation should be in the new world order, especially with seismic disruptions from digital and technological innovations.

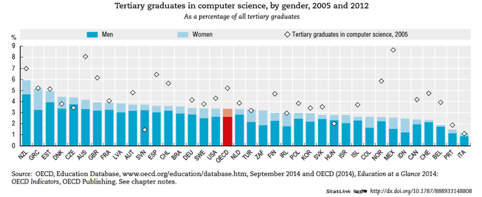
The latest newsletter of the Committee for Melbourne (Committee Communique, August 7 2014) contains an interesting statistic. Survey data undertaken by the World Economic Forum and the Boston Consulting Group (BCG) ranked, in comparison to other G20 states, Australia in the top 5 for early technology adoption (sounds good) but at or below 15th for business use of technology in innovation (sounds bad). This may reflect a willingness to be a consumer of technology but a corresponding failure to capitalize on “digital value creation”. A net outflow of value rather than an inflow.

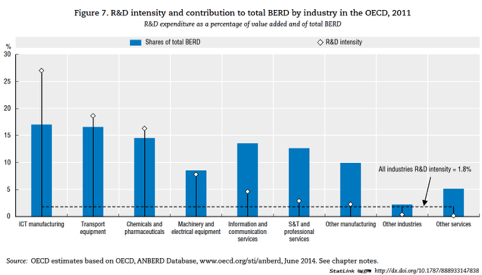
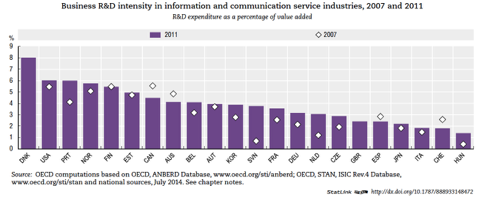
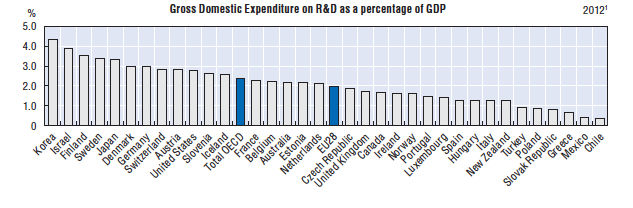
Further evidence for concern is our competitive position in R&D tables published by the OECD (Source: OECD Main Science and Technology Indicators Database, July 2014). While our general expenditure in R&D is slightly above the median:

pasted image 633x208


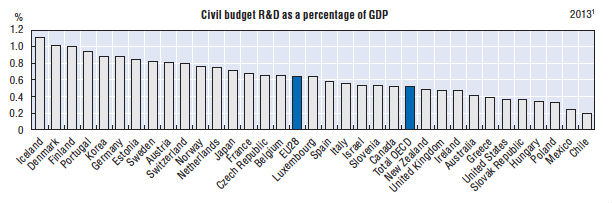
our R&D budget from non-government or university sectors is significantly below the median:

pasted image 612x203


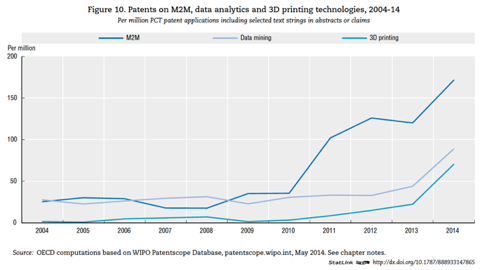
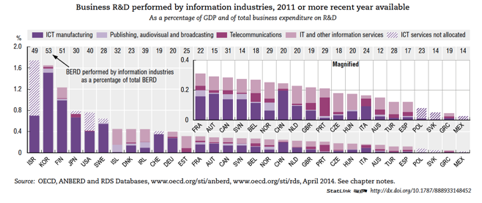
As for international performance in commercialising R&D Australia slips even further as shown in the number of patents (based on the triadic patent definition across three patent office regions – EU, US and Japan):

pasted image 635x196


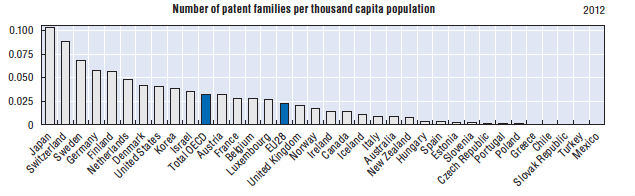
Arguably Australia is not reaping a fair commercial return on the overall R&D investment with some notable exceptions (e.g. Cochlear and CSL).  In this case Australia is not hitting above its weight and may become more exposed to negative risk with evolving models, such as digital economies.

OECD Report – Measuring the Digital Economy

An interesting report titled “Measuring the Digital Economy” recently published, 8th December, by the OECD (OECD (2014), Measuring the Digital Economy: A New Perspective, OECD Publishing). Chapter titles give a sense for the report – Investing in Smart Infrastructure; Empowering Society; Unleashing Innovation; Delivering Growth and Jobs.

While the analysts give insights into numerous aspects of the global digital economy they highlight one key weakness: there is no consistent statistical framework suitable for either describing or measuring what impact or influence digital capabilities, such as the Internet, are having globally. Action points are suggested for policy makers and national statistical bodies to develop a new schema that may harness the power of “micro data” localised inside individual enterprises or even by individuals. This is a different approach to the centralization of data in large sets managed by bodies such as the Bureau of Statistics.

A few snippets from this lengthy document:

Combined ICT accounts for approximately 25% of the total R&D investment by business (BERD) as shown in the following diagram.

pasted image 482x275
with a notable increase, and increasing, spend on Machine to Machine (M2M), data mining and 3D Printing innovations.

pasted image 481x270

Australia’s comparative BERD spend on this ICT R&D is in the lower third of the OECD members – around 12% in comparison to the average of 25% (the top is South Korea at 53%):

pasted image 482x203

Of Australia’s BERD investment in ICT most, unsurprisingly, is in the services sector:

pasted image 482x200


Consistent with popular belief Australia ranks highly in the penetration of personal digital devices which is shown by the following chart, Australia ranking second just behind Finland:

pasted image 482x266

Drilling down on this data more shows an odd characteristic for the Nordic countries, especially Finland, where most mobile service is not standard but dedicated for unspecified purposes:

pasted image 482x274


pasted image 482x271
Maybe a reflection of some innovative M2M use in the Nordic countries?

Another oddity is for the distribution of autonomous system (AS) routing domains – in terms of total numbers, especially in comparison to population, both Russia and Brazil stand out. The report suggests a higher AS value could reflect greater competition in the digital economy space. While potentially true for the USA I’m not sure it applies to Russia.

pasted image 482x209


A disappointing statistic is the number of female graduates in computer science for the year 2012 (see below), which is consistent across all countries.  Further it shows an almost 50% drop in computer science graduates for Australia from 2005 to 2012.

pasted image 482x197